
Contrast Sensitivity: Measuring Visual Perception Beyond Acuity
When we think about vision tests, we often imagine the classic chart of letters getting smaller and smaller. While this measures visual acuity, it only tells part of the story. To truly understand how we perceive the world, we must look at contrast sensitivity—the ability of the visual system to discern differences in luminance (brightness) within a static image.
Contrast sensitivity is not static; it fluctuates based on age and health. Typically, it reaches its peak around age 20, specifically at spatial frequencies of 2–5 cycles per degree (cpd). As we age, this sensitivity progressively declines. Various medical conditions, such as cataracts and diabetic retinopathy, can further attenuate this ability, making it harder to distinguish objects from their backgrounds.
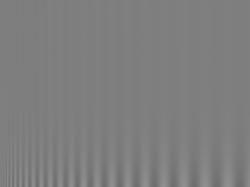
An interesting example of this is the "sweep grating." At a standard viewing distance, bars in the middle of the grating appear longest because they match our optimal spatial frequency. However, if you move further away, the bars that previously seemed too wide now match that optimal frequency, shifting which bars are most visible.
Contrast Sensitivity vs. Visual Acuity
It is a common misconception that normal visual acuity equals perfect vision. Visual acuity is the angle at which a person can resolve two separate points when the image is presented at 100% contrast and projected onto the fovea (the center of the retina). This is why a standard Snellen chart uses high-contrast black letters on a white background.
In contrast, contrast sensitivity measures the ability to distinguish bright and dim components regardless of size. A person might achieve 20/20 vision on an acuity exam but still struggle with daily activities, such as driving at night or climbing stairs, because they cannot perceive low-contrast edges. This is often seen in patients with glaucoma.
To diagnose these differences, clinicians may use a Pelli–Robson chart, which features letters of a uniform size that become increasingly pale grey, testing the patient's threshold for detecting fading contrast.
Measuring Spatial Frequency and the CSF
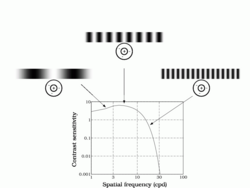
To quantify contrast sensitivity, specialists use sine-wave gratings—parallel bars of varying widths and contrast levels. The width and spacing of these bars define the spatial frequency, measured in cycles per degree (cpd).
- Optimal Range: Sensitivity is highest between 2-5 cpd.
- Upper Limit: The human visual system caps at approximately 60 cpd.
- Reading Requirements: Correctly identifying small letters typically requires a frequency of 18-30 cpd.
The contrast threshold is the minimum contrast a patient can resolve. Contrast sensitivity is calculated as the reciprocal of this threshold (1 ÷ contrast threshold).
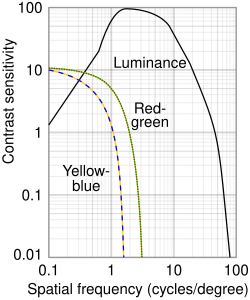
These results are plotted on a Contrast Sensitivity Function (CSF), a log-log plot with spatial frequency on the horizontal axis and the contrast threshold on the vertical axis. The area under this curve provides a graphical representation of visual deficits, even when standard acuity remains normal.
The Biological Basis of Perception
The reason we are most sensitive to intermediate spatial frequencies lies in the center-surround organization of neuronal receptive fields in the retina. In an intermediate-frequency pattern, the brighter bars (peaks) are detected by the center of the receptive field, while the darker bars (troughs) are detected by the inhibitory periphery.
At very low or very high frequencies, the peaks and troughs overlap within the center and periphery, causing excitatory and inhibitory impulses to cancel each other out. Other factors, including anatomical structures and adaptation, also influence how these sinusoidal patterns are transmitted neurally.
Key Facts
- Peak Sensitivity: Occurs around age 20 at 2–5 cycles per degree (cpd).
- Human Limit: The maximum spatial frequency the human eye can detect is about 60 cpd.
- Acuity vs. Sensitivity: 20/20 vision (acuity) does not guarantee high contrast sensitivity.
- Calculation: Contrast sensitivity is the reciprocal of the contrast threshold.
- Clinical Use: CSF curves help monitor dysfunction in diseases like glaucoma or ARMD.
| Feature | Visual Acuity (e.g., Snellen) | Contrast Sensitivity (e.g., Pelli-Robson) |
|---|---|---|
| Primary Measure | Minimum resolvable angle/size | Minimum resolvable luminance difference |
| Contrast Level | High (100%) | Variable (Decreasing) |
| Key Metric | 20/20, 20/40, etc. | Cycles per degree (cpd) / CSF Curve |
| Real-world Impact | Reading small print | Night driving, navigating stairs |
Causes of Decreased Contrast Sensitivity
Reduced contrast sensitivity can stem from various etiologies, ranging from retinal issues to neurological dysfunction:
- Retinal Disorders: Age-related macular degeneration (ARMD) and amblyopia.
- Lens Abnormalities: Cataracts.
- Neural Dysfunction: Stroke and Alzheimer's disease.
Because so many different conditions can cause a drop in sensitivity, these tests are more effective for characterizing and monitoring the progression of a known dysfunction than for detecting a specific disease on their own.
Frequently Asked Questions
Can I have 20/20 vision but still have poor contrast sensitivity?
Yes. Visual acuity tests use high contrast (black on white), which may hide deficits. A person can have 20/20 acuity but struggle to see objects in low-contrast environments, such as during foggy weather or at night.
What is a cycle per degree (cpd)?
A cycle per degree is a unit of spatial frequency. It refers to one pair of light and dark bars (one cycle) that occupies one degree of the visual angle of the observer.
How does age affect contrast sensitivity?
Contrast sensitivity generally increases until about age 20, peaking at 2–5 cpd. After this peak, it progressively declines as part of the natural aging process.
What is the Contrast Sensitivity Function (CSF)?
The CSF is a graph (typically a log-log plot) that shows the relationship between spatial frequency and the contrast threshold. It helps clinicians visualize a patient's visual deficits compared to a normal range.
Why are intermediate frequencies easier to see?
This is due to the center-surround arrangement of neurons in the retina. Intermediate frequencies perfectly align with the excitatory center and inhibitory periphery of these neurons, maximizing the signal.