
Dose-Volume Histograms in Radiotherapy Planning
In the field of radiotherapy, ensuring that a tumor receives a lethal dose of radiation while sparing surrounding healthy tissue is critical. To achieve this balance, clinicians use a Dose-Volume Histogram (DVH). A DVH is a graphical tool that summarizes the 3D dose distribution within a specific anatomical structure, converting complex spatial data into a readable 2D format.
The foundation of any DVH is the dose bin. Bins are predetermined intervals of radiation dose (for example, 0.005 Gy, 0.2 Gy, or 1 Gy). The choice of bin size involves a tradeoff: smaller bins provide higher accuracy but increase the computational power and memory required for storage in databases.
Key Facts
- DVHs summarize the relationship between radiation dose and the volume of the organ receiving it.
- Differential DVHs show the volume of a structure receiving a specific dose range.
- Cumulative DVHs show the volume receiving at least a certain dose.
- Clinical DVHs typically use percent volume on the vertical axis for easier comparison.
- Multiple structures are often plotted on a single graph using different colors for clarity.
Types of Dose-Volume Histograms
Differential DVH
A differential DVH functions like a standard histogram. The horizontal axis represents the dose bins, while the vertical axis represents the volume of the structure (either in absolute terms or as a percentage). The height of each bar indicates the volume of the structure receiving the dose specified by that particular bin.
This volume is calculated by counting the total number of voxels—the smallest 3D volumetric pixels of a medical image—that fall within the specified dose range. Differential DVHs are particularly useful for visualizing the minimum and maximum doses and identifying specific changes in dose distribution within a structure.
Cumulative DVH
The cumulative DVH is the most common format used in clinical settings. Like the differential version, it plots dose bins on the horizontal axis. However, the vertical axis represents the volume of the structure receiving a dose greater than or equal to the dose of that bin.
When very small bin sizes are used, the cumulative DVH appears as a smooth line sloping from the top-left to the bottom-right of the graph. For instance, if a structure receives a perfectly homogeneous dose (where 100% of the volume receives exactly 10 Gy), the graph would show a horizontal line at 100% volume followed by a sharp vertical drop at the 10 Gy mark.
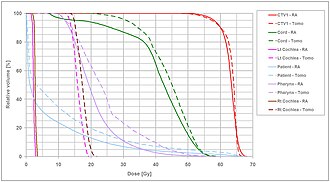
Clinical Application and Visualization
In a clinical radiotherapy plan, a single DVH graph usually includes all targets and organs at risk. Each structure is represented by a uniquely colored line, allowing planners to quickly assess whether the target is sufficiently covered and whether healthy tissues are within safe dose limits. To maintain consistency across different organ sizes, the vertical axis is almost always expressed as a percentage of the total volume.
| Feature | Differential DVH | Cumulative DVH |
|---|---|---|
| Visual Appearance | Bar/Column Histogram | Sloping Line Graph |
| Vertical Axis Meaning | Volume receiving a specific dose bin | Volume receiving $\ge$ a specific dose |
| Primary Use | Identifying min/max dose and dose changes | Evaluating overall dose-volume constraints |
| Horizontal Axis | Dose Bins | Dose Bins |
Frequently Asked Questions
What is a voxel in the context of a DVH?
A voxel is a volume element, which is the 3D equivalent of a pixel. The DVH determines the volume of an organ by counting how many voxels within that organ are characterized by a specific range of radiation dosage.
How does bin size affect a DVH?
Bin size determines the granularity of the histogram. Smaller bins increase the accuracy of the representation but require more computational memory and processing power.
Why is the vertical axis usually plotted as a percentage?
Using percent volume instead of absolute volume allows clinicians to compare dose distributions across different structures regardless of their actual physical size.
What does a vertical drop in a cumulative DVH indicate?
A vertical drop indicates a highly homogeneous dose distribution, meaning a large portion of the volume is receiving nearly the exact same dose of radiation.