
Statistical Inference and the Pitfalls of Data Dredging
Drawing accurate conclusions from data is the cornerstone of scientific research. In the conventional framework of frequentist probability, researchers formulate a hypothesis—such as the idea that social class influences longevity—and collect data to determine if the results are statistically significant. This process involves testing against the null hypothesis, which assumes that any observed effect is due to chance alone.
A fundamental rule of rigorous analysis is that a hypothesis must be tested using evidence that was not used to construct it. Because every dataset contains random patterns, testing a hypothesis on the same data used to generate it makes it impossible to determine if the pattern is a genuine phenomenon or a mere coincidence. For instance, if a coin is flipped five times and results in three tails, hypothesizing that the coin favors tails based on those specific flips is meaningless unless that hypothesis is then tested against a completely new set of tosses.
Key Facts
- Data Dredging: The practice of searching through data to find patterns that can be presented as statistically significant, often leading to spurious results.
- Optional Stopping: Collecting data until a desired p-value is reached, which artificially inflates the likelihood of a false positive.
- Publication Bias: The tendency to publish only studies with significant p-values, leaving negative results in the "file drawer."
- Preregistration: A method to prevent p-hacking by documenting the hypothesis and analysis plan before data collection begins.
- Systematic Bias: Errors in analysis caused by unmeasured confounders or non-random assignment of subjects.
The Danger of Optional Stopping
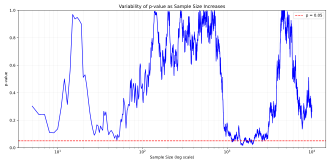
Optional stopping occurs when a researcher continues to collect data until a specific stopping criterion—usually a significant p-value—is met. While this may seem efficient, it is a dangerous practice because the resulting p-value is misleadingly low. A true p-value represents the sum of all events at least as rare as the one observed; optional stopping ignores the "counterfactuals," or the paths the researcher could have taken if the data had looked different.
If the null hypothesis is true, a researcher can eventually reach any significance level simply by continuing to collect data and stopping the moment the p-value dips below the threshold. This is not always a result of misconduct; high data collection costs or animal ethics mandates for early termination can also trigger this issue.
Post-Hoc Manipulations and Grouping
Once data is collected, there are several ways researchers may inadvertently or intentionally introduce bias through post-hoc (after the fact) adjustments.
Data Replacement and Outliers
Removing data points under the guise of "removing outliers" after analysis has already begun increases the false positive rate. Outliers should only be removed if there is a documented, special cause for the variation. Replacing these outliers with new data further compounds the risk of reporting a spurious result.
Post-Hoc Grouping
When a dataset contains multiple features (e.g., age, sex, location), researchers may test various groupings to find a significant correlation. If grouping by age fails, they may try sex, or age controlled for sex. Because the number of possible groupings grows exponentially with the number of features, the probability of finding a random correlation increases significantly.
Spurious Hypotheses and Systematic Bias
Data dredging can lead to hypotheses that are entirely non-representative. For example, if two people in a study share a birthday and also happen to have switched college minors three times, a researcher might hypothesize a link between that birthday and academic instability. While the data may seem to support this, the result is likely non-reproducible because the hypothesis was built on a random coincidence.
Beyond data dredging, systematic bias can distort results. This occurs when there is a consistent error in the analysis, such as when high-risk patients are disproportionately assigned to a specific treatment. Without correcting for these unmeasured confounders, the treatment may appear less effective than it actually is. Similarly, publication bias (or file drawer bias) occurs when only positive results are shared, skewing the scientific community's understanding of a topic.
Multiple Modelling and Selection Bias
In linear regression and machine analysis, researchers must decide which covariates (independent variables) to include in their model. If variables are discarded based on the data itself—such as through stepwise regression—the remaining variables have essentially passed a preliminary test. This creates a selection bias where the retained variables appear to have larger effects than they truly do, potentially altering the mean square error and introducing further bias into the estimation.
| Pitfall | Mechanism | Primary Risk |
|---|---|---|
| Optional Stopping | Stopping data collection once p < 0.05 | Artificially low p-values |
| Post-hoc Grouping | Testing multiple feature combinations | Spurious correlations |
| Publication Bias | Suppressing non-significant results | Skewed scientific literature |
| Data Replacement | Removing outliers after analysis | Increased false positive rate |
| Multiple Modelling | Discarding variables based on data | Overestimated effect sizes |
Frequently Asked Questions
What is the difference between a null hypothesis and a research hypothesis?
A research hypothesis is the specific prediction a scientist wants to test (e.g., "Treatment A is better than Treatment B"), while the null hypothesis is the default position that there is no relationship between the variables and any observed effect is due to chance.
Why is preregistration helpful in scientific research?
Preregistration requires researchers to document their hypotheses and analysis plans before collecting data. This prevents p-hacking and optional stopping by ensuring the researcher cannot change the rules of the analysis to fit the results.
How does the "file drawer effect" impact science?
The file drawer effect, or publication bias, occurs when studies with negative or non-significant results are not published. This leads to an overestimation of the effectiveness of treatments or the strength of correlations in the available literature.
Can outliers ever be legitimately removed from a dataset?
Yes, but only if they are identified and removed based on a special cause variation (such as a measurement error) and this decision is made using a consistent protocol, rather than after the analysis has already suggested a certain result.
What is a confounder in systematic bias?
A confounder is an unmeasured variable that influences both the dependent and independent variables, potentially creating a fake correlation or masking a real one if not properly controlled for in the analysis.